Does your investment portfolio match your appetite for risk?
Did you know that 70 percent of Australian investors seek stable, reliable, or guaranteed returns from their investments? In contrast to their global counterparts, ASX’s 2017 Investor Study found Australians had high levels of risk aversion across all age groups.
Surprisingly it was young investors (18-24yo) who were the most risk averse (80 percent seeking stable, reliable, or guaranteed returns), compared to 67 percent of those aged 25-59 and just 60 percent of investors aged 60+.
Yet, while Australian investors are highly risk averse, their portfolios tend not to be well diversified, suggesting there exists a disconnect between investment decisions and risk appetites.

Diversification
Diversification is an effective way to manage risk/return, limit exposure to any single asset and align your portfolio with the level of risk appropriate for your personal situation.
Some 46 percent of Australian investors claim to hold a diversified portfolio, holding on average 2.7 asset classes (shares, property and/or cash typically). This is slightly better than the 40 percent of investors who identify as non-diversified, who hold an average of 1.7 asset classes.
How to track investment diversity using Sharesight
Fortunately, Sharesight makes it easy to track the diversity of your investments. Using Sharesight’s diversity report, you can examine your portfolio across the following dimensions:
- Market
- Sector Classification
- Industry Classification
- Investment type
- Country
- Do not group (Holdings)
Want to group your investments according to your own asset allocation methodology, for analysis along a custom dimension? You can build your own Custom Groups in Sharesight and organise your holdings accordingly across our various portfolio reports. See our guide on Asset allocation reporting in Sharesight to learn how.

Want to be a diversification superstar?
So, you now understand the asset allocation within your portfolio. But what are the drivers behind your portfolio’s performance? Was it asset allocation, stock selections, or exposures to other factors that were the primary contributors to results?
Sharesight’s Expert Plan lets you unlock the power of the Contribution Analysis Report -- giving you powerful performance attribution capabilities to identify significant under/over performers that may mask your portfolio’s true performance.

FURTHER READING

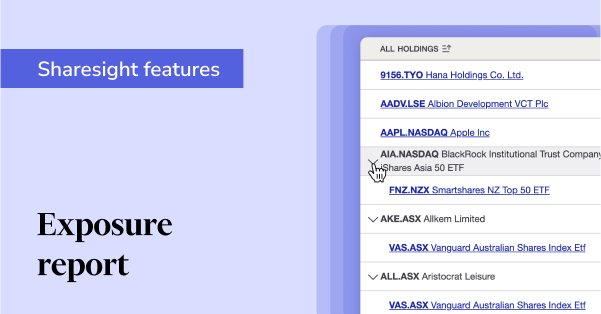
See what’s inside your ETFs with Sharesight’s exposure report
See inside your ETFs and get the full picture of your investment portfolio's composition with Sharesight's exposure report.

How KmacD Financial streamlines reporting and saves time with Sharesight
We talk to financial planning firm KmacD Financial about how the Sharesight-AdviserLogic integration helps them save time and streamline client reporting.

Sharesight product updates – November 2023
The focus over the past month has been on implementing additional feature ideas relating to our new (beta) exposure report.