See what’s inside your ETFs with Sharesight’s exposure report
Get the full picture of your portfolio’s composition with Sharesight’s exposure report. Currently available to Sharesight users on investor and expert plans, the exposure report shows your portfolio’s exposure to different industries, investment types and sectors by listing your direct stock holdings alongside any stocks held within exchange-traded funds (ETFs). With the ability to clearly see any overlap in your portfolio, it’s now easier than ever to make informed decisions about your portfolio’s composition.
Why you need to know what’s inside your ETFs
When looking to diversify their portfolio, many investors turn to ETFs because they allow you to invest in a basket of stocks by purchasing just one instrument. ETFs are typically designed to track an index or a certain ‘theme’ such as tech stocks, for example. This type of bundled asset also makes it easy to invest in global markets, which is another key reason why investors turn to ETFs as a diversification strategy in their portfolio.
The problem is that there is a lack of transparency around what is inside most ETFs. An ETF may be composed of hundreds, even thousands of individual stocks, with the fund manager rebalancing this composition anywhere from daily to yearly. Often, the fund provider will only show investors a portion of what is inside the ETF, such as the top 10 holdings by weight. Some funds may provide investors with the option to download a PDF file of the fund’s entire composition, however you would need to regularly download and review these documents for all of your ETFs, a process that is both tedious and inefficient.
ETFs don’t always guarantee diversity in your portfolio
Without a quick and easy way to see what’s inside your ETFs, there is a good chance that there is some overlap in your portfolio — especially if you own multiple ETFs alongside individual stocks. For example, you may find that you hold some of the same stocks across different ETFs, or you hold an individual stock that is also found in one or more of your ETFs. This dilutes the diversification of your portfolio, which may reduce the efficacy of your investing strategy, especially if diversification is a key component of that strategy.
Why you need Sharesight’s exposure report
By running the exposure report, you can clearly see the breakdown of your portfolio’s composition. The report displays every holding in your portfolio, broken down by its returns in dollar value and percentage value in terms of its contribution to your portfolio’s overall returns. It also makes it easy to see where there is any overlap in your portfolio by displaying whether your holdings are direct holdings or whether they are part of the underlying holdings in one or more ETFs in your portfolio.
In the screenshot example below for instance, you can see that the investor holds Apple (NASDAQ: AAPL) as a direct stock holding, but also as part of two ETFs. Depending on their investment strategy and diversification goals, the investor may decide to sell off some of their direct shares in Apple if they feel they are overweight in this stock. Alternatively, if an investor notices a significant amount of crossover between the holdings in multiple ETFs, they may also choose to sell out of one or more of their ETFs.
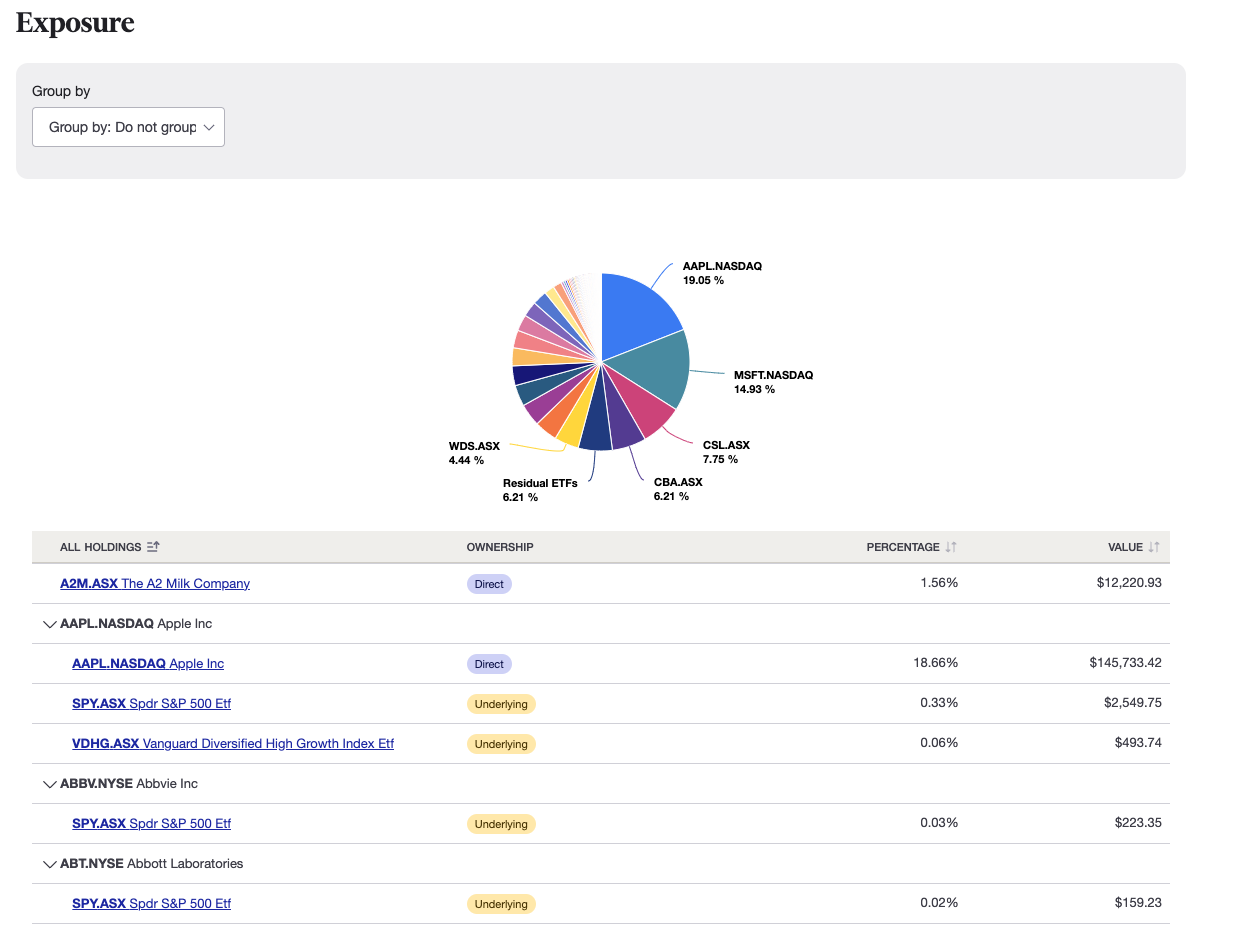 Sharesight’s exposure report shows you the composition of your portfolio, including holdings that you own directly or as part of your ETFs’ underlying holdings.
By giving you the ability to clearly see any overlap in your portfolio, the exposure report helps you make informed investing decisions with confidence. Paired with Sharesight’s diversity and contribution analysis reports (plus a range of other powerful performance and tax reports), the exposure report is a highly useful tool for investors looking to understand their diversity and rebalance their portfolio to better align with their asset allocation target or broader investment strategy.
Other key features
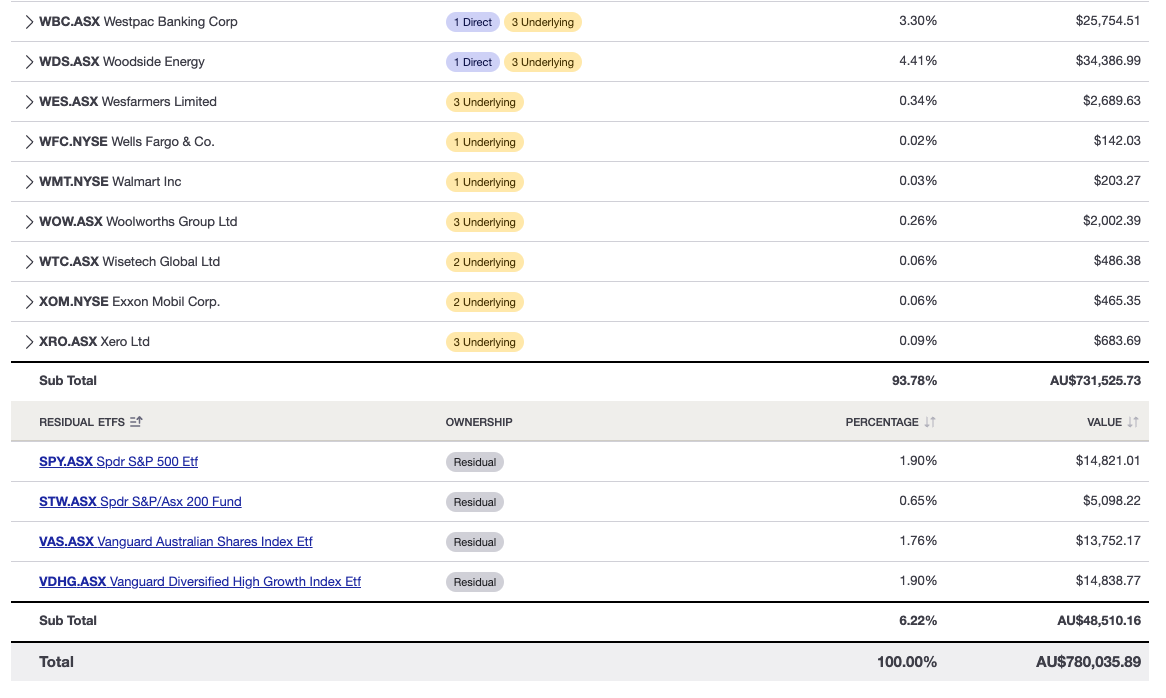
- The report shows you the top 50 holdings (by weight) in each of your ETFs. The remainder of the holdings in these ETFs is categorised under “Residual ETFs” at the bottom of the report, as shown in the example below:
- You can organise your holdings by the grouping of your choice, including market, currency, sector, industry, investment type, country or no grouping
- Data for the holdings in your report is updated daily.

Want to know more about the exposure report?
For a more in-depth look at the exposure report, see our instructional video here:
Embedded content: https://youtu.be/w5RjKvX44-Q?si=l8aPgcf5_SX86yRY
Make smarter investing decisions with Sharesight
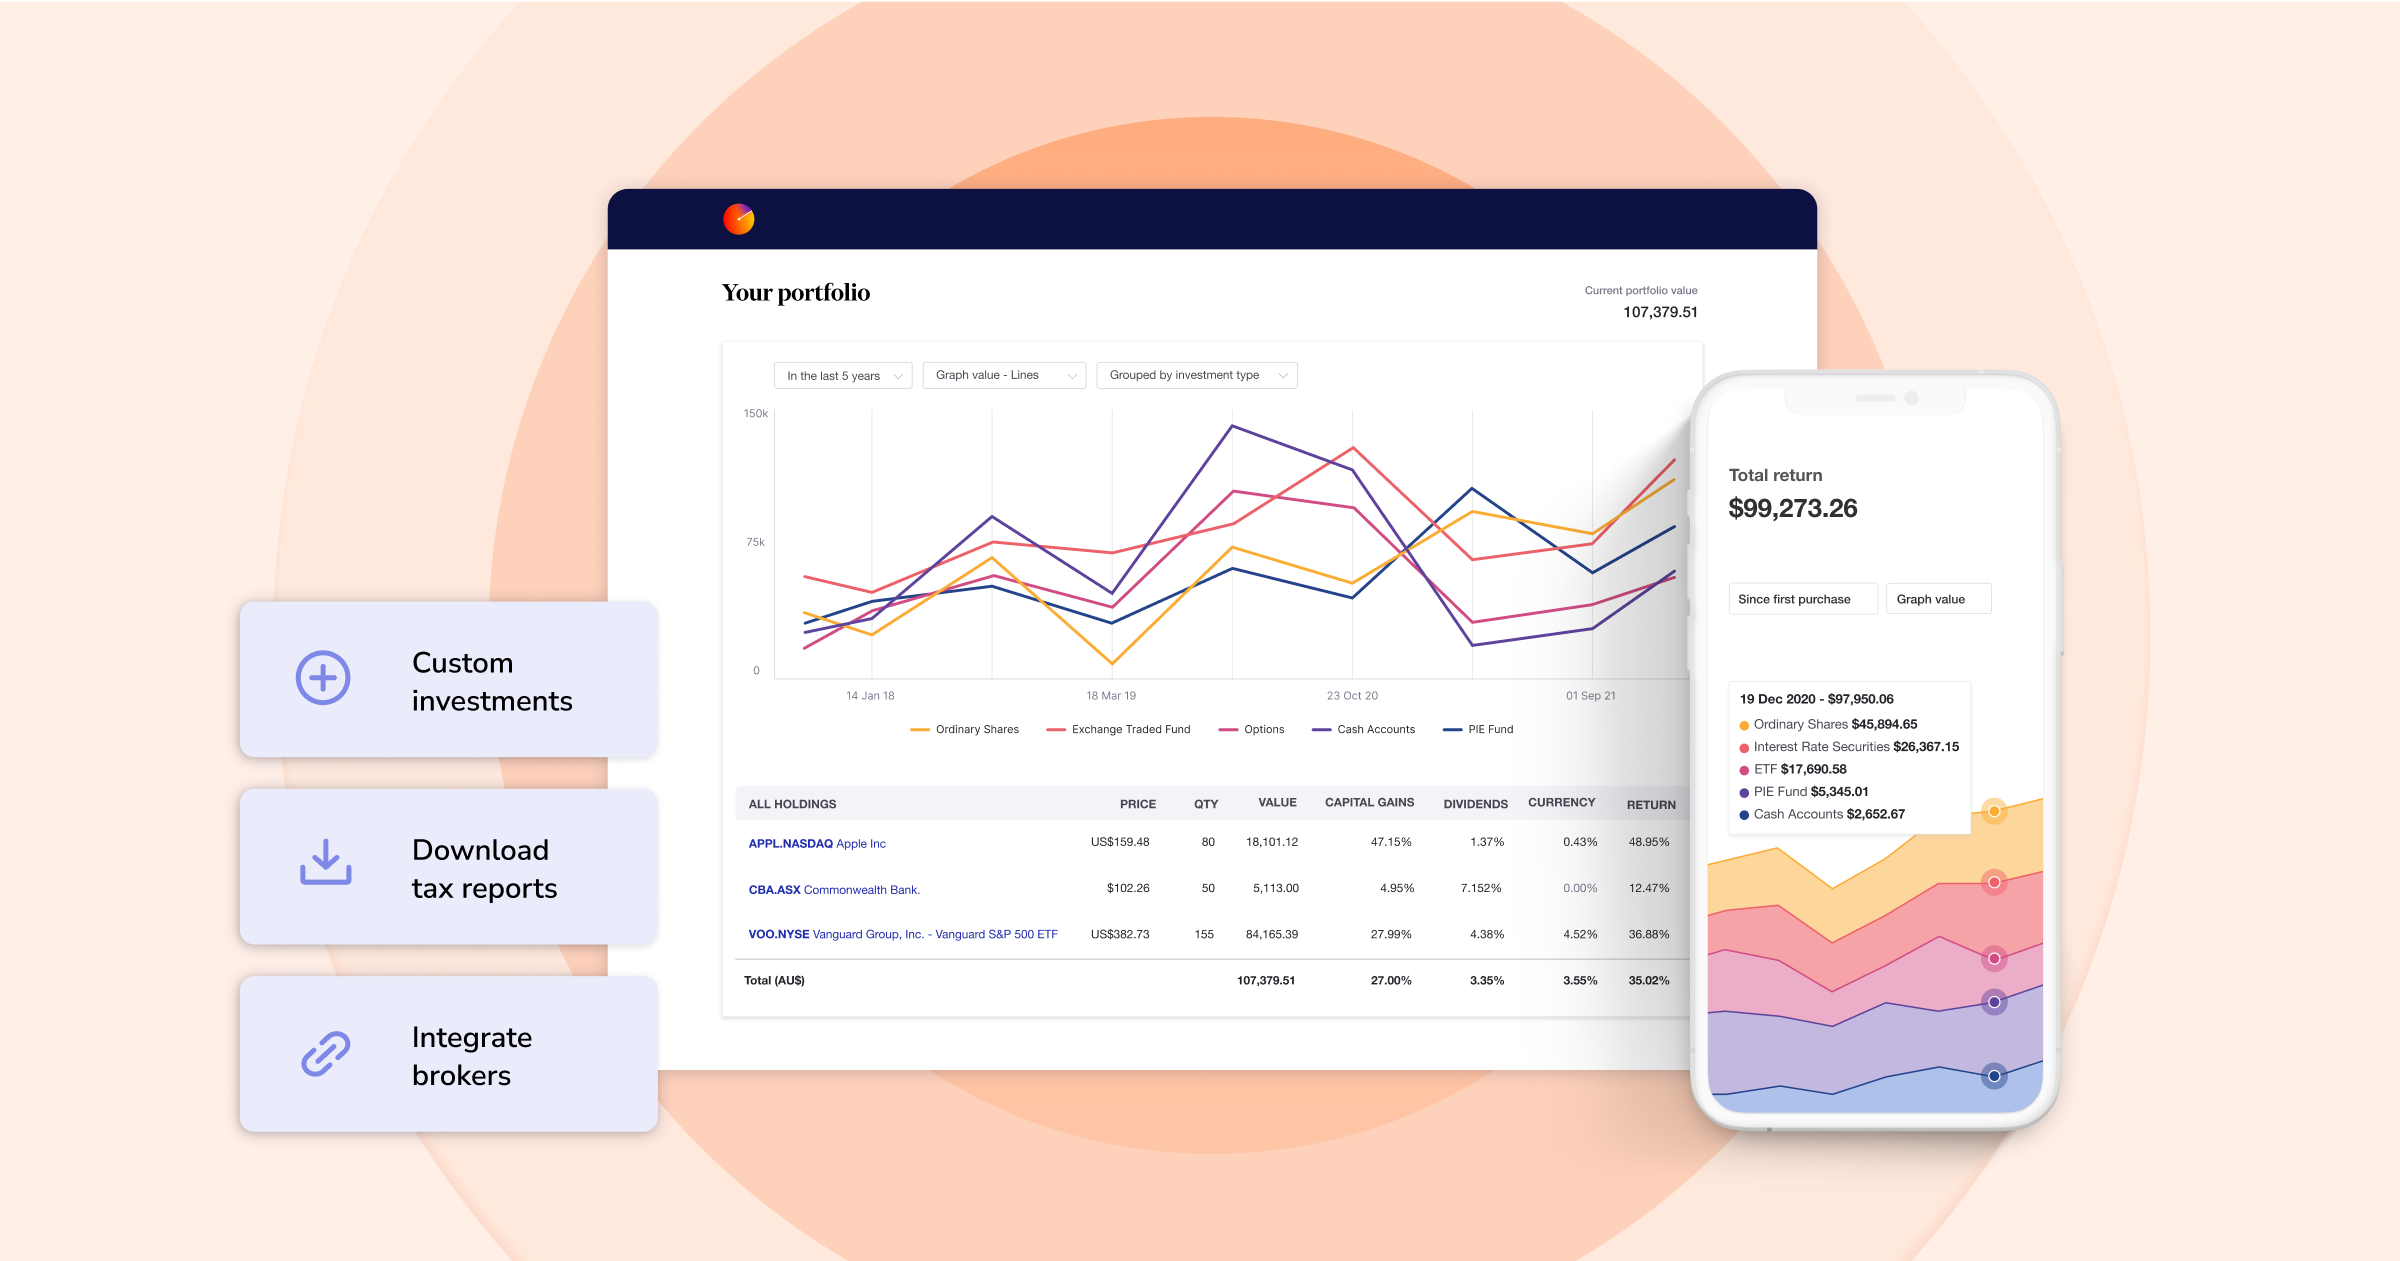
Join hundreds of thousands of investors around the world using Sharesight to automatically track their investment performance and tax, and make smarter investing decisions. With Sharesight you can:
- Track all of your investments in one place, including stocks, ETFs, mutual/managed funds, property and even cryptocurrency
- Automatically track your dividend and distribution income from stocks, ETFs and mutual/managed funds
- Run powerful reports built for investors, including performance, diversity, contribution analysis, future income, multi-period and multi-currency valuation
- See the true picture of your investment performance, including the impact of brokerage fees, dividends, and capital gains with Sharesight’s annualised performance calculation methodology
Sign up for a FREE Sharesight account to get started tracking your investment portfolio today.
Disclaimer: This article is for informational purposes only and does not constitute a specific product recommendation, or taxation or financial advice and should not be relied upon as such. While we use reasonable endeavours to keep the information up-to-date, we make no representation that any information is accurate or up-to-date. If you choose to make use of the content in this article, you do so at your own risk. To the extent permitted by law, we do not assume any responsibility or liability arising from or connected with your use or reliance on the content on our site. Please check with your adviser or accountant to obtain the correct advice for your situation.
FURTHER READING


How KmacD Financial streamlines reporting and saves time with Sharesight
We talk to financial planning firm KmacD Financial about how the Sharesight-AdviserLogic integration helps them save time and streamline client reporting.


Sharesight product updates – November 2023
The focus over the past month has been on implementing additional feature ideas relating to our new (beta) exposure report.


Import historical trades to Sharesight via spreadsheet
You can import your historical trading data by simply downloading a spreadsheet from your broker and uploading it to your Sharesight portfolio.