See how time impacts your portfolio with the multi-period report
As part of Sharesight’s dedication to building out the most comprehensive digital reporting suite for investors, we have introduced our multi-period report, which allows investors to compare their portfolio returns over a choice of up to five distinct or cumulative periods. Available for Sharesight users on Expert and Professional plans, the multi-period report is an easy way to see the impact of a portfolio rebalance, evaluate performance before and after a market correction or even compare a portfolio’s returns against fund manager performance periods. To learn more about how the multi-period report gives investors the information they need to make better decisions, keep reading.
Clearly see the impact of time on portfolio performance
The multi-period report presents a portfolio’s returns over up to five distinct or cumulative periods, with the option to group the results by market, currency, sector, industry, investment type, country or a custom grouping. Not limited to total return values, you can also view the portfolio’s capital gains, payout gains and currency gains in percentage or monetary values. This gives investors the flexibility they need to evaluate their performance against any number of investing strategies or market events.
Assess investment decisions against market events
Comparing distinct or custom periods allows you to clearly assess investment decisions against events such as market corrections, individual asset corrections or portfolio rebalancing. This can be achieved simply by choosing the relevant dates pre- and post-event and grouping the results by an appropriate classification such as market, sector or industry, for example.
Put performance volatility in context
Using the multi-period report to compare cumulative periods makes it easy to understand performance volatility within a broader context. For example, if a portfolio has performed well in previous quarters but underperformed in the latest quarter, this suggests that the investor may need to re-evaluate their investing strategy or determine whether any of their investments have been affected by a market correction or other similar event.
Comparing cumulative periods can also provide an at-a-glance view of a portfolio’s rolling returns across different time horizons, making it possible to benchmark the portfolio against ETF or fund performance periods. This could be useful for investors investing over a long time horizon or planning for retirement, for example.
Track the long-term performance of a dividend portfolio
The multi-period report is a useful tool for dividend investors, as it allows you to effortlessly evaluate the performance of dividend stocks over the long-term. For example, a dividend investor might use the report to compare dividend payouts in their portfolio over several cumulative financial years. With all of the relevant performance information at a glance, investors can clearly identify underperforming dividend stocks and use this information to rebalance their portfolio as needed.
Customise the report to your investing strategy
Categorising the multi-period report by custom groups can give you greater insight into a portfolio’s performance based on the metrics of your choice. The screenshot below, for example, shows a portfolio divided into tech stocks, REITs, ETFs and cryptocurrency. In this specific case, the multi-period report has been used to show the impact of a Q1 correction in Australian and US tech stocks on the overall portfolio.
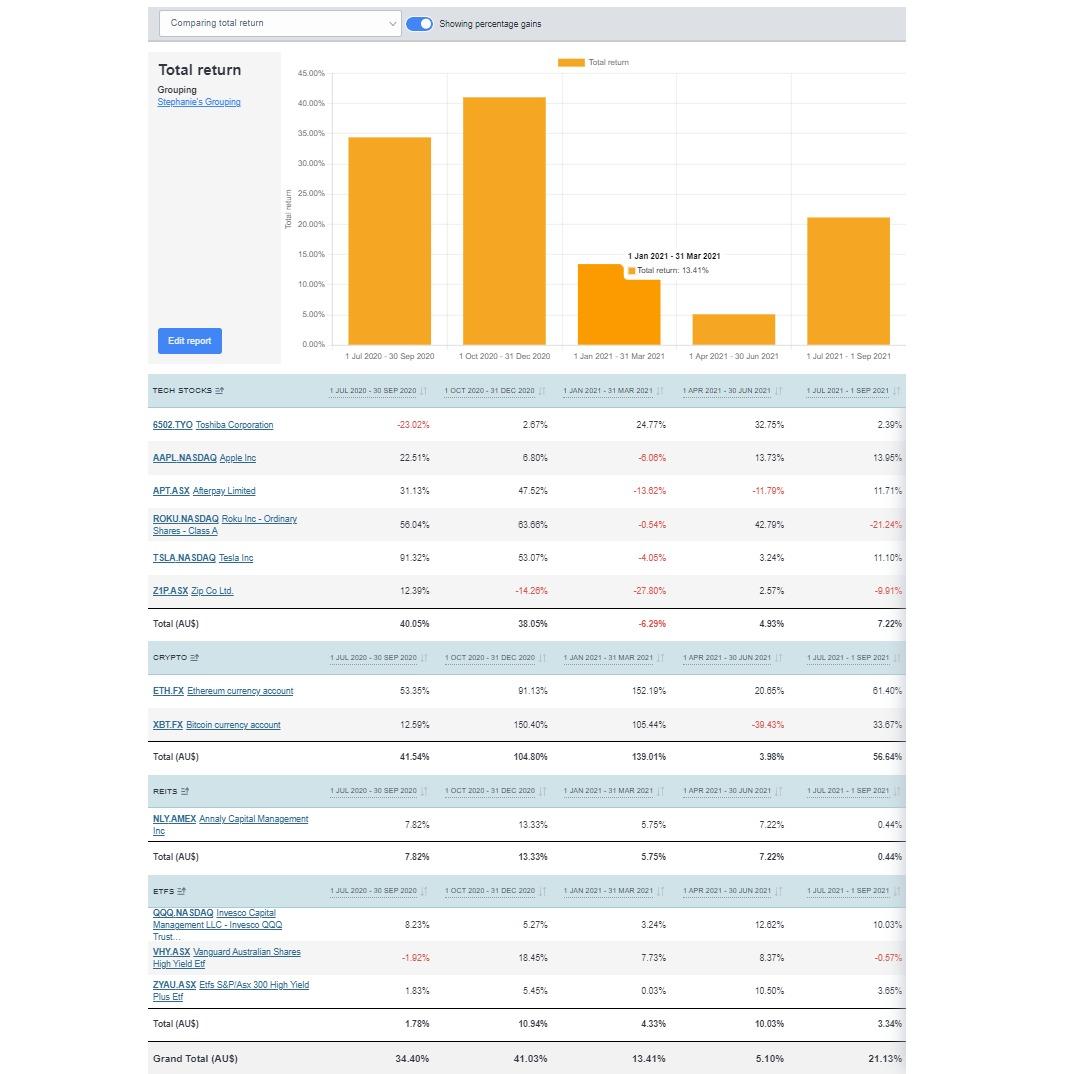
The multi-period report applied to a global portfolio, viewing cumulative quarters filtered by custom groups. This can be a useful way to view the impact of stock market trends or identify underperforming stocks that need to be reviewed.
Running the multi-period report
Running the multi-period report is simple, with an intuitive three-step setup process that allows you to choose from a range of powerful parameters designed for the diverse needs of investors. Once you have chosen your parameters, the report will display an easy-to-read chart followed by more in-depth information on the portfolio’s individual holdings.
Read our help page for more information on how to run the multi-period report, as well as some of the report’s key features. Or you can watch our instructional video on YouTube:
Embedded content: https://youtu.be/2kplAHC3o
Easily share portfolio insights
The Multi-Period Report can be exported to different file formats, including PDFs (coming soon) and Excel spreadsheets. This is a convenient way for investors to share the report with a financial advisor, for example. Professional users will also benefit from the ability to download reports for clients – making it easy for clients to understand their performance while improving the quality of conversation between advisor and client.
Take your reporting to the next level with Sharesight
Take advantage of Sharesight’s suite of powerful performance and tax reporting tools by upgrading to an Expert plan today, or signing up for our plan for financial professionals.
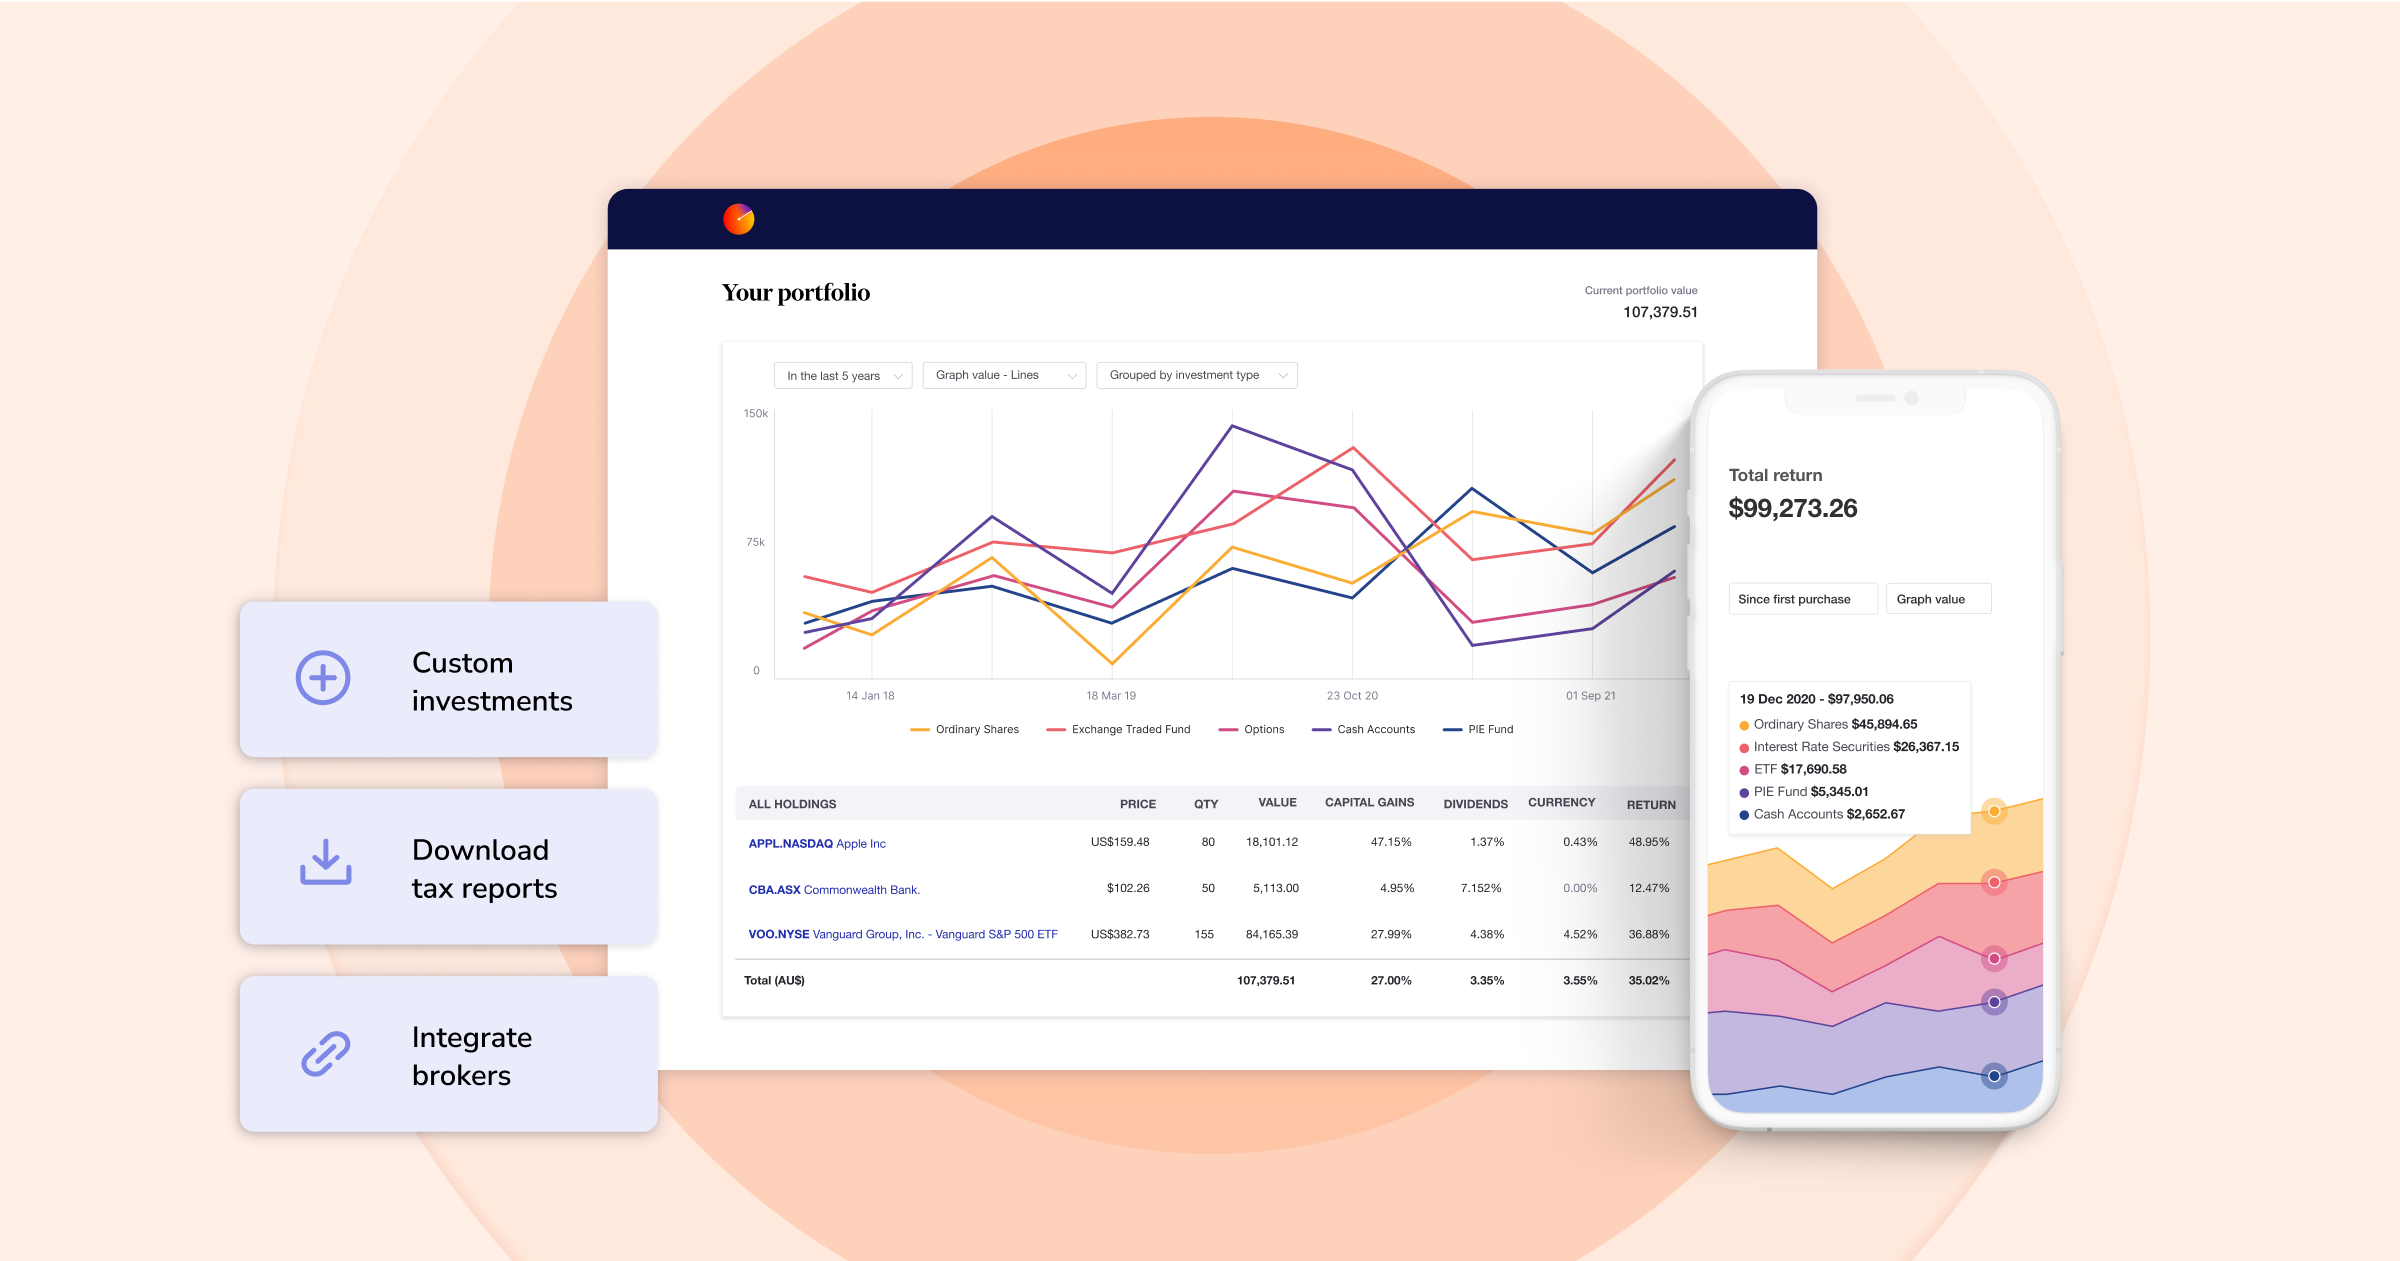
And if you’re not already using Sharesight, what are you waiting for? With Sharesight you can:
- Track all of your investments in one place, including stocks, ETFs, mutual/managed funds, property and even cryptocurrency
- Automatically track your dividend and distribution income from stocks, ETFs and mutual/managed funds
- Run powerful reports built for investors, including performance, portfolio diversity, contribution analysis, future income and multi-currency valuation
- See the true picture of your investment performance, including the impact of brokerage fees, dividends, and capital gains with Sharesight’s annualised performance calculation methodology
Sign up for a FREE Sharesight account and get started tracking your investment performance (and tax) today.
FURTHER READING


See what’s inside your ETFs with Sharesight’s exposure report
See inside your ETFs and get the full picture of your investment portfolio's composition with Sharesight's exposure report.


How KmacD Financial streamlines reporting and saves time with Sharesight
We talk to financial planning firm KmacD Financial about how the Sharesight-AdviserLogic integration helps them save time and streamline client reporting.


Sharesight product updates – November 2023
The focus over the past month has been on implementing additional feature ideas relating to our new (beta) exposure report.