Watch your investment grow
We’ve added a new graph option to the portfolio overview page that lets you visualise the value of your portfolio over time. You can switch between this and the portfolio gains graph by clicking the ‘change’ link to the top right of the graph. As with the other selection criteria, Sharesight will remember your graph choice next time you login, so you will always see your preferred graph right away.

Thanks to all of you who have been providing us with feedback. We have some more great features on the way soon, please keep the feedback coming!

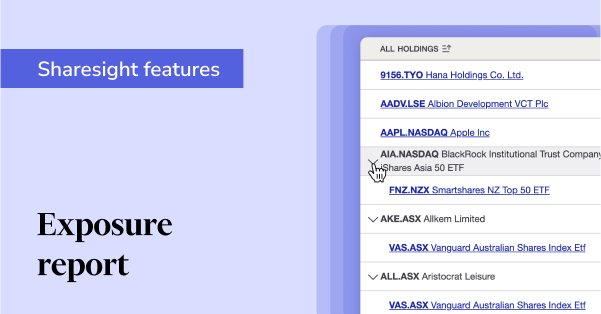
See what’s inside your ETFs with Sharesight’s exposure report
See inside your ETFs and get the full picture of your investment portfolio's composition with Sharesight's exposure report.

How KmacD Financial streamlines reporting and saves time with Sharesight
We talk to financial planning firm KmacD Financial about how the Sharesight-AdviserLogic integration helps them save time and streamline client reporting.

Sharesight product updates – November 2023
The focus over the past month has been on implementing additional feature ideas relating to our new (beta) exposure report.